Iowa Monthly Weather Summary – June 2026
General Summary
Temperatures averaged 70.3 degrees or 0.40 degree above normal while precipitation totaled 5.22 inches or 0.04 inch below normal. June 2026 ties multiple years as the 64th warmest and ranks as the 96th driest June in 154 years of statewide records. A warmer June occurred just last year, while a drier one occurred in 2023.
Temperatures
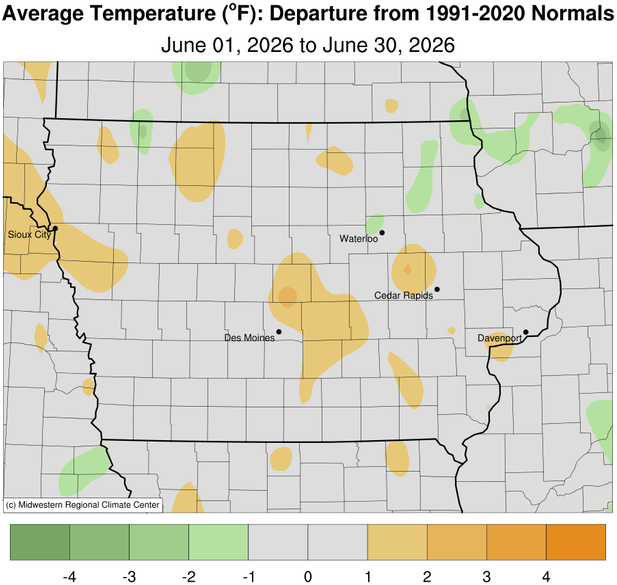
Statewide temperatures were generally near normal across Iowa with scattered pockets of slightly warmer conditions; overall, the first half of June was generally warmer than average while the second half trended cooler. Pockets along the Iowa-Minnesota and Iowa-Missouri borders reported near-normal monthly temperatures. June’s statewide average maximum temperature was 80.8 degrees, 0.2 degree above normal while the average minimum temperature was 59.9 degrees, 0.7 degree above normal. Little Sioux (Harrison County) and Sioux City Airport (Woodbury County) reported the month’s high temperature of 97 degrees on the 28th and 29th, respectively, on average 12 degrees above normal. Elkader (Clayton County) reported the month’s low temperature of 41 degrees on the 3rd, 11 degrees below normal.
Cooling Degree Days
Home cooling requirements, as estimated by cooling degree day totals, averaged 22% less than last June and 3% more than normal. Cooling degree day totals are running 23% less than last year at this time and 6% less than normal.
Precipitation
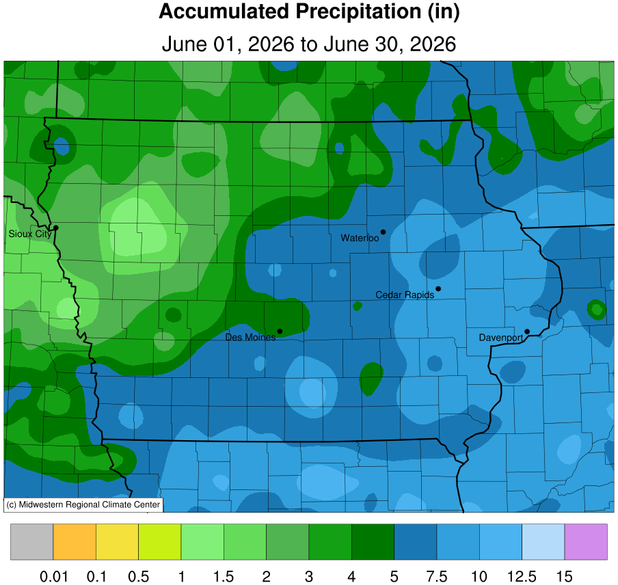
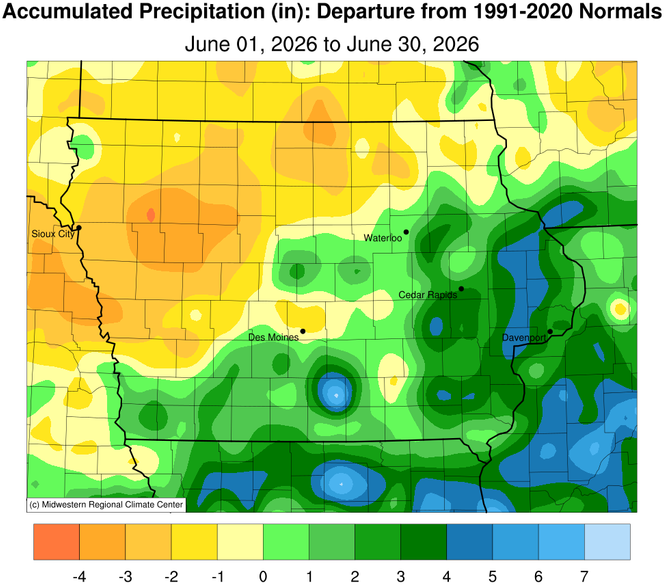
The southeastern half of Iowa experienced wetter than average conditions with locations in extreme eastern and south-central Iowa reporting above normal totals approaching five inches. On the flip side, the state’s northwestern half experienced unseasonable dryness with widespread deficits in the 2.00-4.00-inch range. Monthly precipitation totals ranged from 0.92 inch in Cherokee (Cherokee County) to 14.75 inches at a Community Collaborative Rain, Hail and Snow (CoCoRaHS) network gauge in Russell (Lucas County).
June was marked by an active and stormy weather pattern, with multiple rounds of showers and thunderstorms producing frequent rainfall across Iowa. Most precipitation occurred in association with organized mesoscale convective systems (MCSs) and slow-moving frontal boundaries, resulting in highly variable rainfall over short distances. While several days remained dry between storm systems, repeated convective episodes prevented prolonged drying and maintained favorable soil moisture across much of the state. The first significant rainfall event occurred on June 4th, when a cold front swept across Iowa and generated a widespread line of thunderstorms. More than 130 observing stations measured at least 1.00 inch of rain, with nearly 30 stations exceeding 2.00 inches. Rainfall was heaviest from central into northeast Iowa, where localized totals reached 4.00 inches and the statewide average precipitation was 0.84 inch. An even more active period unfolded from June 10–12 as successive low-pressure systems and cold fronts tracked through the Upper Midwest. Multiple rounds of severe thunderstorms produced widespread heavy rainfall, large hail, damaging straight-line winds, and several tornadoes. Nearly 45 stations received at least 2.00 inches during the June 10–11 event, with localized totals exceeding 6.50 inches in south-central Iowa. Additional thunderstorms on June 11–12 dropped another 1.00 to 3.00 inches across much of eastern Iowa, resulting in widespread flash flooding, washed-out roads, and rapid rises on small streams.
Another organized convective complex crossed the state on June 16–17, producing damaging winds exceeding 90 mph in central Iowa, an EF-2 tornado in northeast Iowa, and another swath of heavy rainfall extending from north-central into eastern Iowa. Nearly 130 stations reported at least 1.00 inch of rainfall, while localized totals surpassed 4.00 inches in Muscatine County, prompting numerous flash flood warnings. The latter half of June remained unsettled, though rainfall became more episodic. Several weaker frontal passages produced generally light to moderate precipitation, interrupted by localized heavy thunderstorms over southwest Iowa on June 20–21 and northwest Iowa on June 27–30. While these later events were less widespread, pockets of 2.00 to 3.00 inches were common beneath the strongest storms.
Overall, June precipitation was dominated by convective processes, producing sharp rainfall gradients and substantial spatial variability. Despite localized flooding from repeated heavy downpours, the recurring rainfall events provided widespread moisture replenishment during the height of the growing season, helping sustain favorable soil moisture conditions across much of Iowa while easing drought concerns in many areas.
Severe Weather
June was a very active month for severe weather across Iowa, with multiple episodes of organized thunderstorms producing damaging winds, large hail, tornadoes and flash flooding. Several storm systems tracked through the Upper Midwest, repeatedly interacting with warm, moisture-rich air to create an environment favorable for widespread severe convection.
The first notable outbreak occurred on June 4–5 as a cold front crossed the state, producing scattered reports of large hail and damaging straight-line winds. Although severe reports were relatively isolated, the storms produced widespread heavy rainfall across central and eastern Iowa, setting the stage for an active pattern through the remainder of the month. A prolonged period of severe weather followed from June 10–12 as successive low pressure systems traversed the region. Thunderstorms organized into multiple squall lines and bowing segments, producing widespread damaging winds, large hail and several tornadoes. On June 10th, a convective line crossing Iowa later was classified as a derecho as it accelerated into Illinois. Additional severe storms developed later that day over southern and eastern Iowa, spawning weak tornadoes in Decatur and Davis counties. Overnight into June 11th, another tornadic squall line crossed southwest Iowa, producing several tornadoes and widespread wind damage. A measured wind gust of 90 mph near Essex (Page County) accompanied extensive agricultural and structural damage, including destroyed grain bins near Villisca (Montgomery County).
Severe weather remained ongoing through June 11th as the squall line bowed across eastern Iowa, generating numerous damaging wind reports before additional afternoon supercells developed over southeastern Iowa. Favorable wind shear supported another tornado near Ainsworth in Washington County before storms weakened during the evening. Another significant outbreak occurred on June 16–17 when a powerful squall line developed over north-central Iowa. A strong rear-inflow jet intensified the system, producing widespread severe wind damage with measured gusts ranging from 64 mph near Storm Lake (Buena Vista County) to 94 mph near Marshalltown (Marshall County), where crop damage and structural impacts were reported. As the storms progressed into eastern Iowa, widespread flash flooding accompanied the damaging winds. Additional discrete thunderstorms later developed across northeast Iowa, producing an EF-2 tornado near Elon (Allamakee County) before crossing into Wisconsin.
Several additional severe weather episodes occurred during the second half of the month. Thunderstorms on June 24th produced isolated severe storms across northeast Iowa, while a vigorous convective complex crossed northern Iowa on June 27–28 with reports of large hail, damaging winds and heavy rainfall. A 58-mph wind gust was measured near Britt (Hancock County), and 2.00-inch diameter hail was reported near Delmar (Clinton County). The month concluded with another round of severe thunderstorms across northwest Iowa on June 29–30, bringing wind gusts to 75 mph near Fostoria (Dickinson County) and a brief tornado near Stacyville (Mitchell County).
Overall, June featured numerous severe weather episodes driven by repeated passages of strong synoptic systems and mesoscale convective complexes. Damaging straight-line winds were the predominant hazard, though the month also produced multiple tornadoes, large hail, localized flash flooding and several significant wind events. The frequency and geographic extent of severe thunderstorms made June one of the more active severe weather months of the season, with impacts reported across nearly every part of Iowa.
US Drought Monitor (USDM)
The US Drought Monitor showed improvement across much of Iowa due to above-average rainfall across portions of the existing Abnormally Dry (D0) and Moderate Drought (D1) regions. At the beginning of June, D0 covered 70% of Iowa with 3% coverage D1. As of June 30, 33% of Iowa was rated at some level of dryness or drought. D0 covered much of the state’s northern extent along with a swath of western Iowa, with an overall coverage of 21%. Two pockets of D1 were introduced in western and north-central Iowa, covering 12% of the state. According to Iowa Drought Plan (IDP) trigger tables updated on June 4th, Drought Region 1 remained classified as in a “Watch” with the remaining Drought Regions seeing static or degrading conditions.
Justin Glisan, Ph.D.
State Climatologist of Iowa
Iowa Dept. of Agriculture & Land Stewardship
Hoover State Office Bldg.
Des Moines, IA 50319
Telephone: (515) 281-8981
E-mail: [email protected]
Weather by Districts
| TEMPERATURE (F) | COOLING DEGREE DAYS | PRECIPITATION (inches) | ||||||||
| June 2026 | June 2026 | Since Jan., 1, 2026 | June 2026 | Since Jan.1, 2026 | ||||||
| DISTRICT | Average | Departure* | Average | Departure* | Average | Departure* | Average | Departure* | Average | Departure* |
| Northwest | 69.9 | +0.7 | 179 | +9 | 229 | +6 | 2.48 | -2.36 | 10.84 | -4.73 |
| North Central | 69.4 | +0.6 | 168 | +10 | 222 | +15 | 3.52 | -1.90 | 14.21 | -3.72 |
| Northeast | 67.9 | -0.3 | 135 | -9 | 180 | -8 | 6.16 | +0.25 | 19.62 | +0.69 |
| West Central | 70.9 | +0.7 | 201 | +13 | 275 | +26 | 2.69 | -2.27 | 12.06 | -4.61 |
| Central | 70.6 | +0.5 | 194 | +9 | 274 | +26 | 5.47 | +0.05 | 18.88 | +0.67 |
| East Central | 70.2 | +0.1 | 181 | -1 | 250 | +4 | 9.37 | +4.01 | 19.97 | +1.33 |
| Southwest | 71.8 | +0.6 | 222 | +10 | 318 | +30 | 5.58 | +0.38 | 17.17 | -0.74 |
| South Central | 71.6 | +0.7 | 216 | +15 | 319 | +47 | 6.73 | +1.61 | 20.53 | +1.88 |
| Southeast | 71.4 | +0.2 | 210 | +2 | 309 | +22 | 7.22 | +2.09 | 19.34 | +0.11 |
| STATE | 70.3 | +0.4 | 186 | +5 | 228 | -15 | 5.22 | -0.04 | 16.76 | -1.15 |
* Departures are computed from 1991-2020 normals.
The weather data in this report are based upon information collected by the U. S. Dept. of Commerce, NOAA National Weather Service.