Iowa Monthly Weather Summary – November 2025
General Summary
Temperatures averaged 39.8 degrees, 2.9 degrees above normal while precipitation totaled 1.39 inches or 0.43 inch below normal. November 2025 ties 1939 and 1962 as the 37th warmest in 153 years of statewide records. It also ranks as the 66th driest November on record. November 2024 was warmer while 2023 was drier.
Temperatures
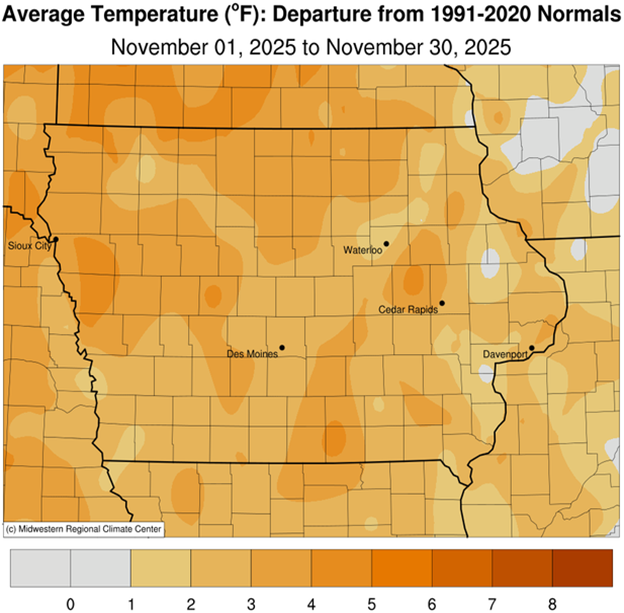
All of Iowa’s National Weather Service (NWS) stations reported unseasonably warm temperatures for the month. Overall monthly average temperatures were up to four degrees above normal across swaths of western and northern Iowa.
November’s statewide average maximum temperature was 49.7 degrees, 3.3 degrees above normal while the average minimum temperature was 29.9 degrees, 2.5 degrees above normal. Several stations reported the month’s high temperature of 76 degrees on the 14ᵗʰ, on average 27 degrees above normal. Spencer Municipal Airport (Clay County) reported the month’s low temperature of -6 degrees on the 30th, 25 degrees below normal.
Heating Degree Day Totals
Home heating requirements, as estimated by heating degree day totals, averaged 5% more than last November and 10% less than normal. Thus far this heating season, heating degree day totals are running 34% more than last year at this time and 2% more than normal.
Precipitation
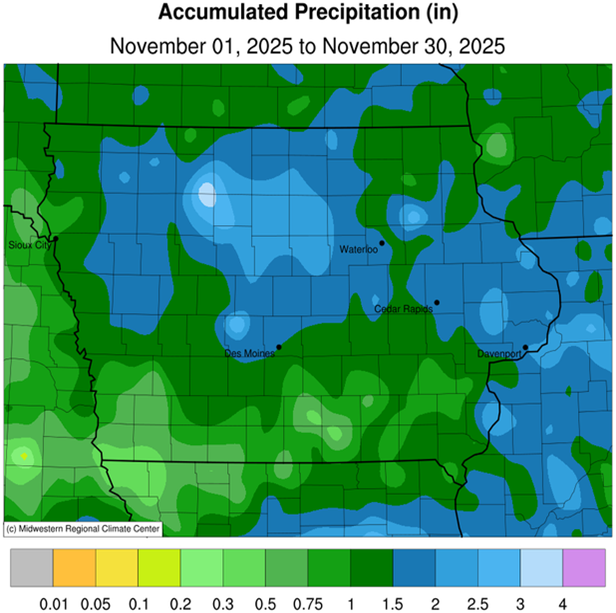
Most of Iowa reported below-normal precipitation through November, particularly across Iowa’s southern one-third where deficits approached 1.50 inches. Only northwestern Iowa reported above-average totals, primarily due to the liquid-equivalent of snowfall from the end of the month snowstorm.
Monthly precipitation totals ranged from 0.14 inch at Rathbun Dam (Appanoose County) to 3.91 inches in Oelwein (Fayette County). Iowa’s average snowfall was 8.6 inches, 5.9 inches above normal, ranking as the 4th snowiest November in 138 years of snowfall records. An observer in Fort Dodge reported the highest monthly snowfall at 19.0 inches.
Fall Summary
Temperatures over the three autumn months (September-October-November) averaged 54.6 degrees or 4.1 degrees above normal while precipitation totaled 5.13 inches, 2.86 inches below normal. Fall 2025 ties 2024 as the 4th warmest fall in the period of record; it also ranks as the 27th driest fall on record. Fall 2016 was warmer (3rd warmest) while 2022 was drier.
US Drought Monitor
The US Drought Monitor (USDM) showed degradation in conditions across northwest and eastern Iowa through the month. A northeast to southwest swath of Iowa state remained in “status quo” conditions. As of the first week of December, 65% of Iowa is in drought or abnormal dryness. The area designated as D0 (Abnormally Dry) is at 44%, down from 51% one month ago. The area designated as D1 (Moderate Drought) is at 21%, up from 12% one month ago. According to the Iowa Drought Plan (IDP) trigger tables updated on December 4, Drought Regions 1, 3 and 5 are classified as in a “Drought Watch” while the remaining Drought Regions are classified as “Normal” with degrading conditions in Drought Region 2 and stable conditions in Drought Region 4.
Winter Outlooks
La Niña conditions emerged in September as cooler oceanic waters expanded across the central and eastern portions of the equatorial Pacific Ocean. La Niña is the cold phase of a large-scale, multi-decadal climate pattern known as the El Niño–Southern Oscillation (ENSO). The phase of ENSO can yield clues about wintertime temperature and precipitation behavior across the United States; the correlation between ENSO and cold-season behavior is much more significant than that in the warm season, which is dominated by smaller-scale convective processes.
The CPC’s final December outlook shows higher chances of colder temperatures with drier conditions possible across Iowa’s southwestern half. In terms of meteorological winter (December-January-February) outlooks show a classic La Niña signal across the United States. Outlooks indicate that colder temperatures are more likely with no clear precipitation signal. Analog winters with a weak La Niña present suggest the potential for slightly above-average snowfall across Iowa, with better chances of more snow farther another.
Overall, winter outlooks are difficult to pin down, given various factors that have been mentioned above. Of course, forecasts (and predictability) break down faster the farther out the models. As such, meteorologists and climatologists use analog years when a phase of ENSO is present. This gives us better guidance on the large-scale flow setup but also what past events have given us, particularly in terms of temperature and snowfall potential. Also of importance is the fact that there is higher correlation between the ENSO phase and wintertime behavior as opposed to summertime behavior, which is dictated more by sub-continental scale processes – convection/thunderstorms.
Justin Glisan, Ph.D.
State Climatologist of Iowa
Iowa Dept. of Agriculture & Land Stewardship
Wallace State Office Bldg.
Des Moines, IA 50319
Telephone: (515) 281-8981
E-mail: Justin.Glisan@IowaAgriculture.gov
Weather by Districts
| TEMPERATURE (F) | HEATING DEGREE DAYS | PRECIPITATION (inches) | |||||||||
| SNOWFALL | |||||||||||
| November 2025 | November 2025 | Since Jul., 1, 2025 | November 2025 | Since Jan.1, 2025 | Nov 2025 | ||||||
| DISTRICT | Average | Departure* | Average | Departure* | Average | Departure* | Average | Departure* | Average | Departure* | Average |
| Northwest | 38.1 | 3.8 | 807 | -113 | 1233 | -365 | 1.40 | 0.00 | 29.28 | -0.47 | 10.8 |
| North Central | 37.9 | 3.3 | 813 | -98 | 1273 | -325 | 1.68 | +0.03 | 36.74 | +2.79 | 9.5 |
| Northeast | 38.3 | 2.9 | 801 | -89 | 1261 | -310 | 1.45 | -0.59 | 33.82 | -2.65 | 10.7 |
| West Central | 39.8 | 3.2 | 756 | -96 | 1113 | -333 | 1.34 | -0.14 | 33.50 | +1.54 | 6.7 |
| Central | 39.7 | 2.6 | 759 | -79 | 1101 | -322 | 1.65 | -0.20 | 37.08 | +2.39 | 10.6 |
| East Central | 40.2 | 2.3 | 744 | -70 | 1073 | -297 | 1.53 | -0.65 | 31.17 | -4.69 | 8.8 |
| Southwest | 41.3 | 2.5 | 711 | -76 | 1019 | -288 | 0.96 | -0.73 | 28.34 | -5.86 | 3.5 |
| South Central | 42.0 | 2.7 | 690 | -82 | 977 | -314 | 1.05 | -0.95 | 31.27 | -4.40 | 4.6 |
| Southeast | 42.2 | 2.5 | 684 | -74 | 959 | -287 | 1.22 | -1.01 | 30.30 | -5.89 | 6.3 |
| STATE | 39.8 | 2.9 | 754 | -82 | 1455 | +33 | 1.39 | -0.43 | 32.62 | -1.58 | 8.6 |
* Departures are computed from 1991-2020 normals. Due to the federal government shutdown, observations are still preliminary.
The weather data in this report are based upon information collected by the U. S. Dept. of Commerce, NOAA National Weather Service.